Case Study 02 · Distribution & Third-Party Logistics

Retailer-Grade Scorecards, Automatically, From the Data You Already Capture

An analytics layer that turns ERP and shipment data into PIFOT, on-time, and fill-rate scorecards. It lives right inside the operations app and refreshes every fifteen minutes during business hours.

The Problem

Every retailer asks for PIFOT and on-time, and for most 3PLs the answer is still assembled by hand, late, and a little different every time.

The Result

Live scorecards that match the retailer's number, so nobody's rebuilding a spreadsheet every Monday.

Embedded Power BI dashboard showing PIFOT, on-time, and fill-rate scorecards with drill-down by retailer, workcenter, and channel
  • An automated ETL pipeline pulls fresh data from both the legacy ERP and the operational database every fifteen minutes during business hours, plus a deeper refresh overnight.
  • A star-schema warehouse pre-computes the SLA flags (picked-in-full, shipped-on-time, PIFOT, fill rate, days early or late) at both the shipment and the line-item level.
  • A Power BI report, embedded right inside the operations app, surfaces daily and monthly rollups with year-over-year and month-over-month comparisons, drillable by customer, workcenter, and channel.
  • Every ETL run is logged with row counts, timing, and per-loader success or failure, so the numbers are defensible to a retailer compliance team.
Results
~15 min PIFOT refresh, down from weekly
~1 analyst-day/wk freed from rebuild work
~7 days of reporting lag eliminated
  • PIFOT and on-time visibility within minutes, not days.
  • Hours of analyst time recovered each week. The weekly spreadsheet exercise turns into a refresh-and-glance.
  • A defensible source of truth for retailer scorecard disputes, with every metric reproducible and every ETL run logged.
  • A shift from reactive to proactive ops: catching shipments at risk at 11am instead of explaining the miss after the fact.
  • Customer-facing scorecard capability. The same dashboard can be shared out to retailers and brands with the data scoped appropriately.

Every retailer produces a number. Yours rarely matches.

Every retailer who matters (Amazon, Walmart, Target, CVS, Dick's, and the rest) measures your performance pretty much the same way. They want PIFOT (picked in full, on time), on-time delivery, and fill rate, broken down by DC, by week, and by channel. And they'll produce their own version of the number, send it to you, and dispute yours if it doesn't line up.

For most 3PLs, answering that question is a weekly fire drill. An analyst pulls extracts from the WMS, reconciles them by hand against the TMS or the ERP, fights with a couple of timezone bugs, drops the result into a spreadsheet, and emails it around. The number is already a few days stale by the time anyone reads it. It rarely matches the retailer's number exactly. And by the time it lands on someone's desk, the week is already over. There's no fixing the misses, just explaining them.

Underneath all that is the fact that the data lives in two places that don't agree: the legacy ERP (the system of record for orders and customers) and the modern operational database (where shipment status, ship windows, and validation events actually happen). Reconciling them by hand is what makes the weekly report slow. Reconciling them once, properly, is the work nobody has time to do.

A dedicated analytics layer that turns two data sources into one number.

Every fifteen minutes during business hours, an ETL pipeline reads from both the legacy ERP and the operational database, lands what it finds in a star schema, and pre-computes the SLA flags retailers actually care about. A Power BI report sits on top, embedded right inside the operations app. The dashboard that runs the Monday review is also the one that's one click away during the day.

Four pieces that turned the weekly fire drill into a live dashboard.

Step 01

Unify the legacy ERP and the operational data into one model

Situation

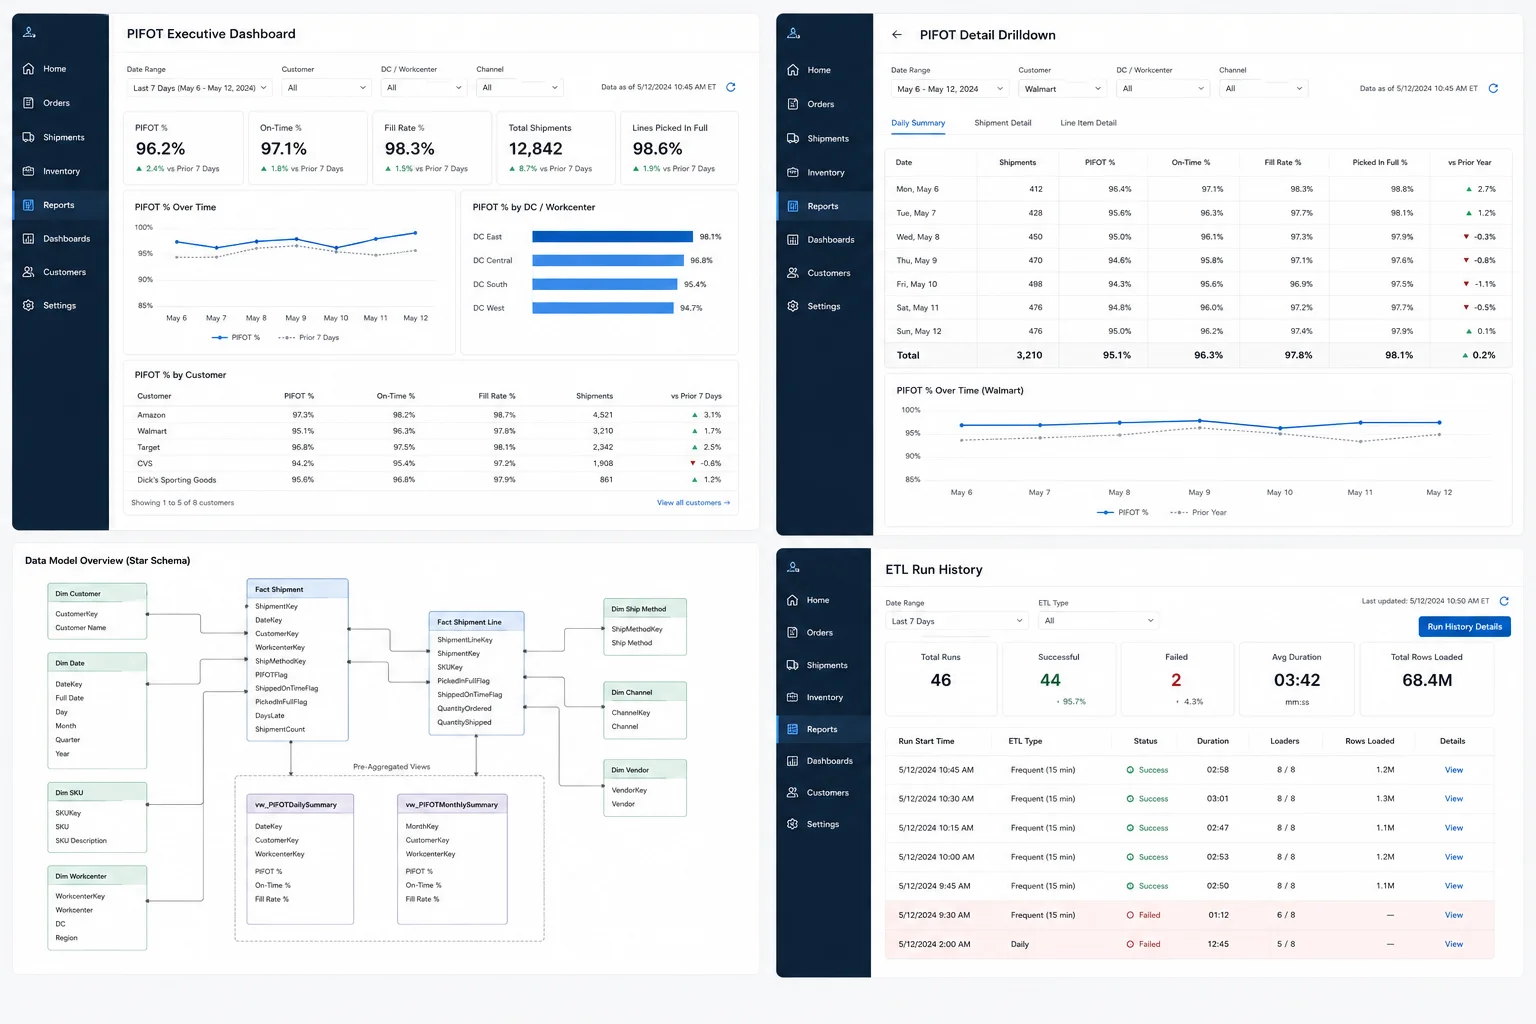
Orders, customers, and historical financial data live in the legacy ERP. Shipment status, ship windows, validation outcomes, and customer-specific rules live in the modern operational system. Neither side, on its own, can answer "did we hit PIFOT this week."

Task

Pull both sources into a single query-able model that's authoritative for SLA reporting.

Action

An ETL service reads from the legacy ERP through its own data layer and from the operational SQL Server, lands the data in a clean star schema with eleven dimension tables and seven fact tables, and exposes pre-aggregated views for the queries that run most often.

Result

One source of operational truth that reconciles back to both sides and is friendly to BI tools.

Step 02

Pre-compute the SLA flags that matter, at the right grain

Situation

PIFOT, fill rate, on-time, days late. Every one of those metrics has a precise definition, and every one of them can be argued about if it's computed differently in different places.

Task

Compute them once, store them, and let every downstream use lean on the same numbers.

Action

A shipment-fact loader computes the SLA flags at the shipment level: picked-in-full, shipped-on-time, PIFOT, and the rest. A line-item-fact loader does the same at the line level. Pre-aggregated views roll those flags up for daily and monthly reporting.

Result

Whether you're looking at a corporate KPI tile or the retailer-facing scorecard, the same definition produces the same number.

Step 03

Refresh fast enough to be operational, not just retrospective

Situation

A weekly report tells you what already happened. A live dashboard tells you which shipments are at risk right now.

Task

Refresh often enough that operations can act on the data, without crushing the source systems.

Action

A scheduled worker runs a "frequent" ETL every fifteen minutes during business hours for the metrics that change intra-day, and a deeper "daily" ETL overnight. Run locks keep them from overlapping, and every run is logged with timing and per-loader success.

Result

The PIFOT dashboard reflects the day's performance within minutes, not days. Operations can stop explaining the miss after the fact and start catching it while it's still preventable.

Step 04

Embed the dashboard where the operations team already lives

Situation

Reporting tools that live outside the operations app get ignored. People log into the app every day. They don't log into the BI tool every day.

Task

Make the right scorecard one click away from the work.

Action

A Power BI report is embedded inside the operations app's Analytics page. Authentication is handled at the workspace level through an Azure AD service principal, so there's no token plumbing for the end user.

Result

PIFOT, on-time, and fill rate live at the same URL as the shipment list. The numbers and the work are right next to each other.

Technical detail (for the engineers in the room)

A dedicated .NET 8 ETL service orchestrates eleven dimension loaders and seven fact loaders against a SQL Server analytics database. Pre-aggregated SQL views materialize the daily and monthly PIFOT rollups so Power BI queries stay fast. DAX measures define the canonical KPIs (PIFOT rate, on-time rate, picked-in-full rate, fill rate, plus failure breakdowns and time-intelligence variants). The Power BI report is embedded into the React and Material-UI client through the standard Azure AD service-principal embed flow.

The stack at a glance:

  • .NET 8 · ETL orchestrator sequences dimension-then-fact loader runs, with run locks so two refreshes can't trip over each other
  • Scheduled worker runs a frequent ETL every fifteen minutes during business hours (Eastern) and a deeper daily ETL overnight
  • SQL Server · star schema holds the analytics warehouse, with the shipment-fact loader computing PIFOT, on-time, fill-rate, and lead-time flags at the shipment grain
  • Pre-aggregated SQL views materialize the daily and monthly rollups Power BI hits the most
  • Power BI · DAX defines the canonical KPI measures so every tile and scorecard is computing the same number the same way
  • React · MUI · Azure AD embed the Power BI report inside the operations app's Analytics page through a service-principal embed flow
Why this matters for your 3PL

The scorecard you produce should be the scorecard you run by.

If your weekly PIFOT report is still being rebuilt by hand, you're paying for it twice. Once for the analyst's time, and again for every chargeback you didn't see coming. What we built for our client isn't fancy. Unify the legacy and operational data once, pre-compute the SLA flags, refresh often, and embed the dashboard where the team already works. The whole point is to turn the scorecard into something the team can run by, not just something you produce for your customers.

Want this kind of visibility in your operation?

Book a free 30-minute call. We'll talk through where your PIFOT number lives today, and what it would take to make it live, drillable, and defensible.

Book Discovery Call
(407) 349-3633